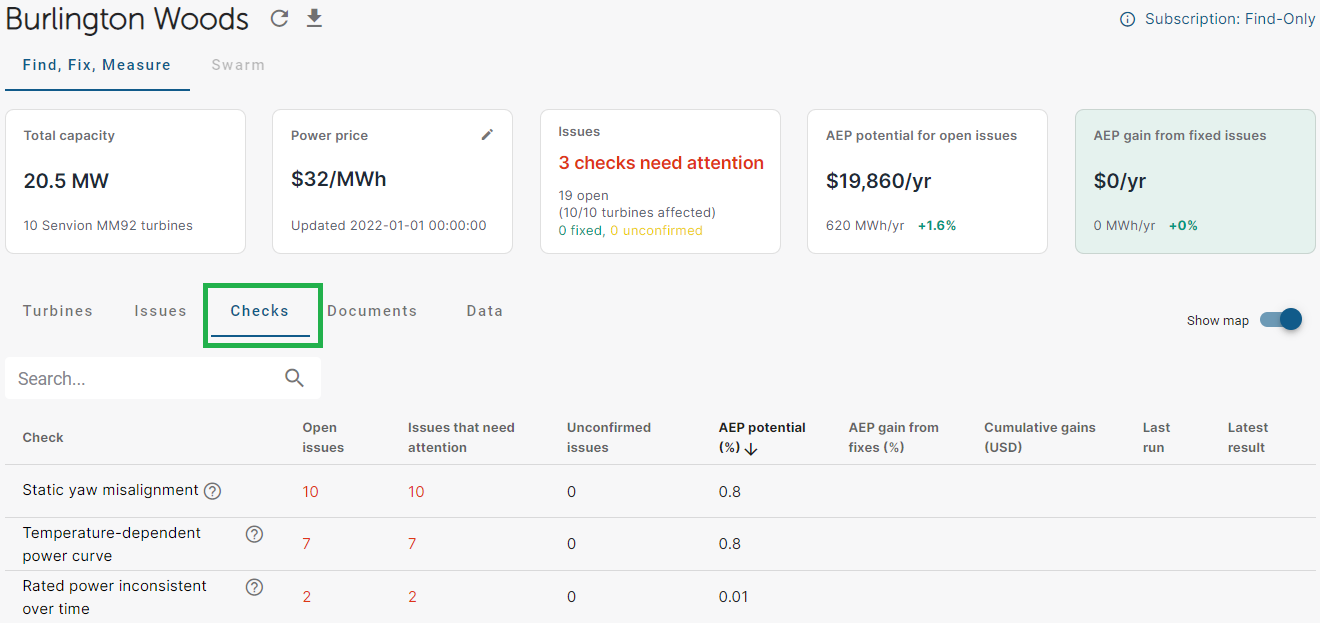
Example of how to navigate to a site or wind farm
Let’s take a look at the wind farm named “Burlington Woods”. To see the details of the site you could click in two places (highlighted in green)
From the wind farm’s main page we can see several things at a glance:
For example, we can see that this site has three open issues that need attention and the detailed description of those issues is listed below:
If you know your site format well, the turbines with issues are also highlighted in the site map:
We can also see the site has 1.2% AEP potential to be gained back with a correction, which translates to $8,846/year:
Note in contrast that “Cumulative Loss” represents the losses since the issue was discovered on the specific turbine. If the issues were already resolved, the gains would be shown here:
In this case, however, all the issues are still showing as “New” or “In Progress”
If you’d like to change the way you see your site you can click the ‘carrot’ and select “Turbines” or “Checks” as well:

If we click “Turbines” we will see a description of the number of open issues on all the turbines at a site:
Or if you want to understand the different checks that have been run on a site:
We are constantly adding to the checks we run for sites and will be continuously adding to the list for reference. Note as a new user of the product we are still in the process of adding our backlog of checks and there may have been additional turbine issues run historically that we are still inputting into our system going forward.
