Given the complexities between power curves, anemometers, and NTFs how do we review turbines?
In our last discussion we addressed the rotor equivalent wind speed (REWS) and it's benefits and limitations.
To summarize, the NTF/anemometer/power curve relationship is challenging because it raises several questions that have no straightforward answers, or questions with several possible explanations:
- Is the NTF correct for the anemometer?
- Has the anemometer failed?
- Is the power curve change from the OEM curve due to:
- Incorrect NTF
- Blade damage
- Bad controller tuning
- Yaw misalignment
- Wind flow characteristics, i.e. REWS
- Etc.
It can be difficult to determine which is the reason for the power curve deviation from expected
- Unfortunately, power curves are easy to make and understand conceptually, so they are used universally
- REWS is a better way to visualize a power curve, but more difficult to calculate in operation
Good turbine controller design and analysis will minimize the usage of wind speed for major decisions for exactly this reason. Even WindESCo's EIA can be affected by NTF changes as well as controller or mechanical optimizations.
Alternative approaches: Power vs. Rotor Speed
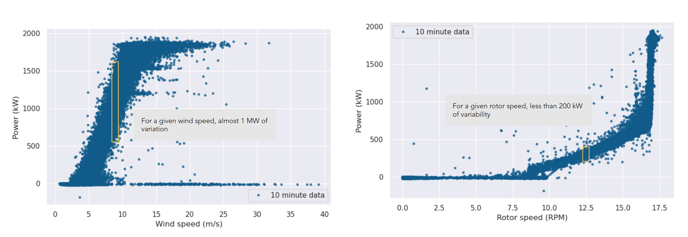
One approach to reviewing turbine performance is analyzing the power vs. rotor speed rather than power vs. wind speed. As we see in the below example, this site has significant variability in power for a given wind speed, which could be due to wind conditions or other factors:

In the analysis of this site, Power vs. rotor speed is a more reliable and consistent visualization of turbine performance.
So what *can* you see in a power curve?
As you might expect, it all depends on analysis within the greater context of site analysis.
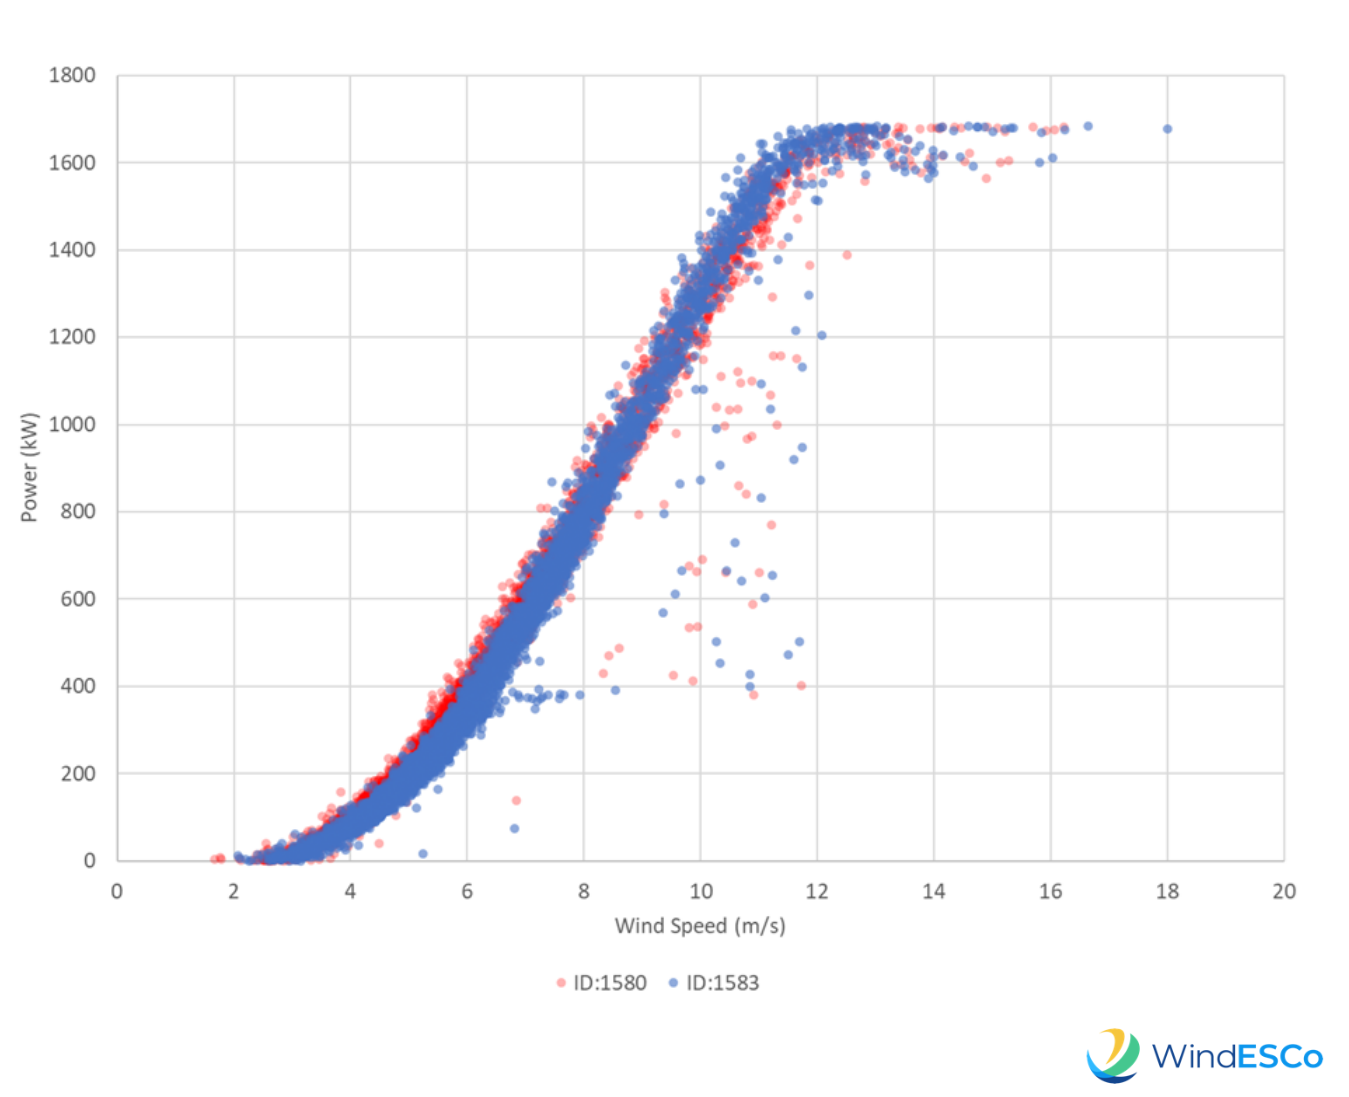
Here is an example, two turbines, one with 6° of yaw misalignment, resulting in a 1% AEP loss (1.1% in Region 2).
Yaw misalignment affects Region 2, but it is not clear which turbine has the misalignment (it’s the red one!)
So, using power curves to identify performance losses is not the optimal approach.
Differences in power curve can be explained by bad NTF, REWS, software or performance differences. It's important to note, you cannot tell the source of the underperformance just by looking!
This is a big educational hurdle to overcome when someone is used to conventional analysis techniques.
How can I improve my power curve?
There are two approaches to improving a power curve:
- Improve performance to move a power curve up
- This is difficult, as it requires true efficiency improvements
- Many approaches instead modify the NTF to move the power curve left
- This is easy, just change the settings for the NTF, but at the loss of energy production
It is important to understand which you are paying for when you're looking to improve your analysis.
Be wary of NTF applications
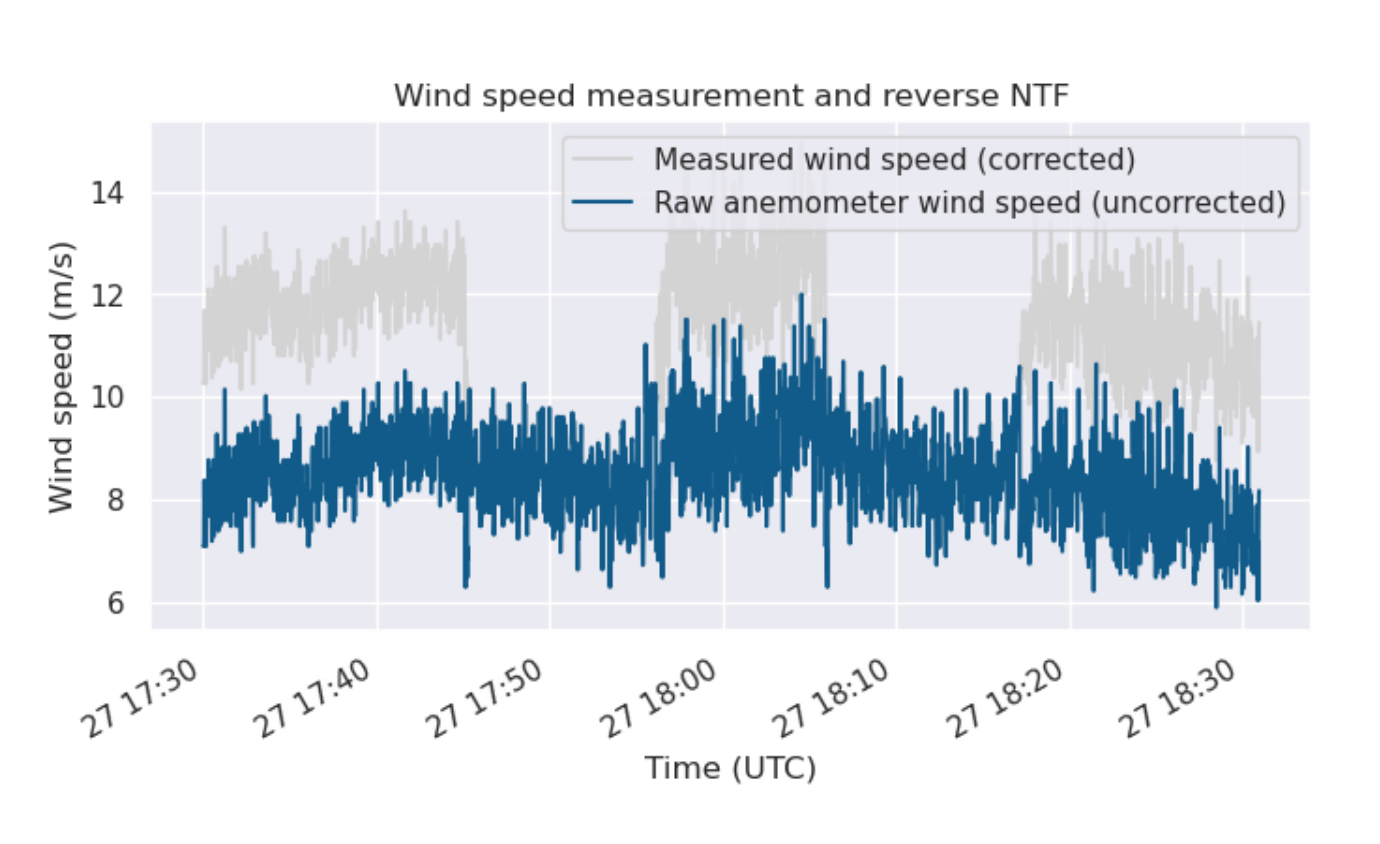
In this example, an OEM only applied the NTF correction when the generator RPM exceeds a certain value. Below that, no NTF is applied. The figure on the below shows the difference between the corrected and uncorrected wind speed measurements. 
In this case, the customer lowered the cut-out wind speed and ended up with a cycle of starting and stopping, which was not a likely intended behavior and caused increased wear on components.
What should you remember from all this?
- Power curves are not useful for evaluating performance because they are sensitive to so many parameters and conditions and can be impossible to determine why a power curve changed.
- NTFs can’t be trusted, but what else are you going to? Try to avoid using wind speed measurements to assess turbine performance as much as possible because it is easier to move a power curve left than it is to move it up. Keep in mind rotor equivalent wind speed (REWS)!
- There are strong options to look at data more objectively, including vs. rotor speed and pitch angle, or by binning with TI, wind speed, REWS, peer to peer, etc.
As always, WindESCo is here to help you to develop a holistic view and is always available to help sort out the complexities!

