Why Nacelle Power Curves Can Be Misleading for Energy Improvement Assessments
In our last video, we laid out the basic requirements for a successful methodology to assess the energy improvement from wind turbine upgrades: ...
3 min read
WindESCo Oct 21, 2020 7:00:00 PM

As a wind plant owner or operator, you have implemented or considering implementing various power curve upgrades for your turbines.
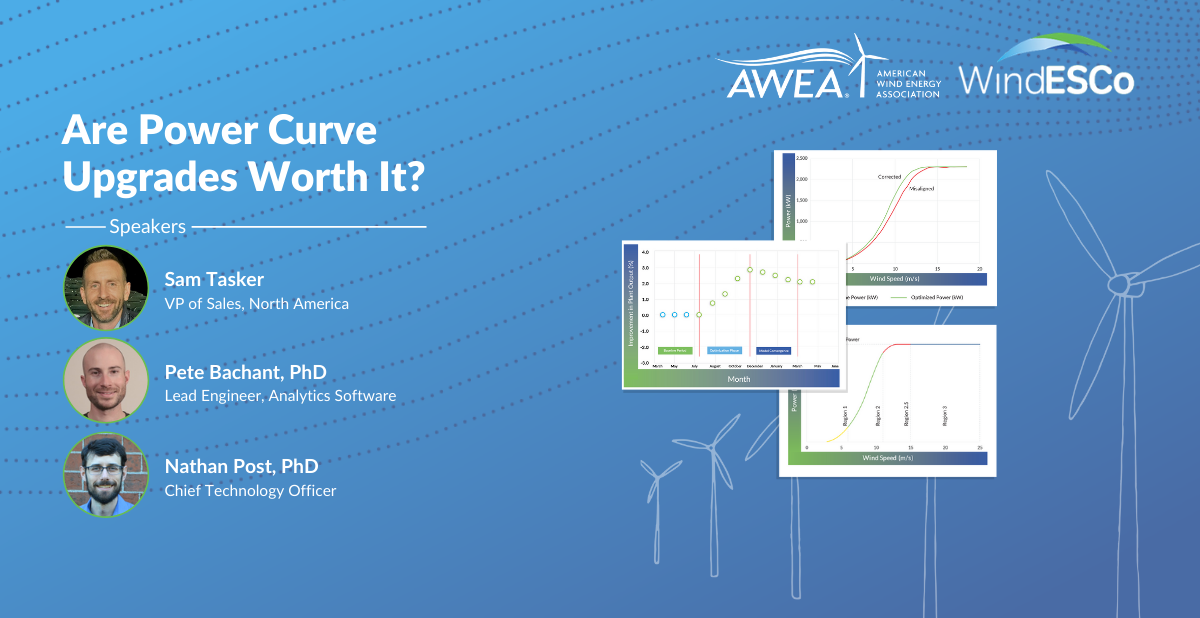
We recently held a webinar called "Are Power Curve Upgrades Worth It?" and asked our audience: Which power curve upgrades have you tried? What was the ROI for the upgrade? Were you comfortable with the method used to calculate increased AEP? Our in-house experts took the time to explain various assessment options and why some are more effective than others.
Three WindESCo experts presented the webinar: Sam Tasker, VP of Sales for North America; Pete Bachant (PhD), Lead Engineer for Analytics Software; and Nathan Post (PhD), Chief Technology Officer.
You can get access to the webinar while reading our 5 key takeaways by clicking here.
How do wind plant operators quantify energy improvement after an upgrade? We have opinions, but we wanted to know what this process looks like from your perspective. We asked our attendees to answer a few questions.
Question #1: What performance upgrades have you made to your wind turbines in the past? (Participants could select more than one option)
Question #2: What techniques have you tried to measure your energy improvement? (Participants could select more than one option)
We also heard that the most common upgrades tend to be those implemented by OEMs, such as PowerUp by GE, PowerPlus by Vestas, or Energy Thrust by SGRE. Software and controller upgrade methods aren’t far behind!
Surprisingly, one-third of our respondents had not used side-by-side analysis of SCADA data, nacelle power curves, or hardware-based power curves. However, the majority have tried one or all of the listed power curve upgrades. This tells us what we already know to be true: wind plant owners and operators are on the hunt for the right combination of power curve upgrades, but they need the tools and expertise to determine which option is best for their situation.
Our experts explored the options available to you for assessing changes in power output after an upgrade. They took the time to explain each method, how it worked, and whether it was appropriate to measure the upgrade's ROI. Finally, they concluded that side-by-side analysis powered by machine learning is the best option currently available.
However, there is one big takeaway here: machine learning can be a powerful tool for assessing energy improvement but needs proper expertise. A model applied incorrectly will produce an incorrect result, so domain expertise is critical if you want to make use of machine learning effectively.
Why is it so important to find the right measurement method for your upgrades? Here is one of the most important takeaways from this event: The ROI on power curve upgrades can be confirmed with higher confidence when proper, accurate measurements are used. This allows you to truly prove the ROI on the investment you make.
Need an example? See our case study from a recent engagement with UPC Renewables. In our work with the wind plant, not only were we able to identify areas of loss and implement turbine solutions, we were able to conclude that a 2% increase in AEP could equate to a $5,700/MW increase in annual revenue.
A few of our attendees wanted to know how WindESCo fits into the process. One asked, “How does WindESCo actually increase AEP?”
“That is the core of our business,” said Nathan Post. “Helping our customers improve output. We’ve developed a number of proprietary algorithms for detecting various issues on the turbines. In [our work with UPC Renewables], we were able to achieve a significant increase in energy output due to large yaw misalignment detected on their turbines. Not only did we detect the problem, we provided offsets that they needed to do to correct each of the turbines, then we supported them in correcting the problem and measure the energy improvement. Yaw misalignment is one example—we are able to detect various other anomalies. We look at your pitch and your dynamic yaw behavior and are continuing to develop more algorithms as we speak.”
One attendee found themselves looking toward the future. They asked us, “Will the machine learning method become an industry standard?”
“Certainly, we think there’s a lot of value in the machine learning method,” said Nathan. “There are a number of different groups using it, so I think it will gradually work towards being a standard, or at least a technical specification to start with. For right now, we need to continue publishing and presenting results to build towards a consensus among the scientific and engineering wind community on how these methods should be used. WindESCo is right here and wants to be part of that process.”
We’re excited to have had the opportunity to spend some time with wind plant owners and operators, explaining the assessment process and hearing some of their questions, concerns, and experiences.
If you missed the chance to join us, don’t worry—it’s not too late! Download your free webinar materials to access the recording of the webinar and our slide deck so you can learn about which method we recommend for energy improvement validation methods.

In our last video, we laid out the basic requirements for a successful methodology to assess the energy improvement from wind turbine upgrades: ...

WindESCo now runs 64 individual checks on our Customer’s SCADA to uncover turbine performance anomalies across the entire wind turbine system,...

In every wind plant, operators are looking to maximize turbine performance to increase their AEP and their top-line revenue number. There are...